Why MLflow + Portkey?
No-Code Integrations
Automatic instrumentation for 20+ GenAI libraries with one line
Detailed Traces
Capture inputs, outputs, and metadata for every step
Debug with Confidence
Easily pinpoint issues with comprehensive trace data
Gateway Intelligence
Portkey adds caching, fallbacks, and load balancing to every request
Quick Start
Setup
- Add provider in Model Catalog → get provider slug (e.g.,
@openai-prod) - Get Portkey API key
- Use
model="@provider-slug/model-name"in requests
Supported Libraries
LLM Providers: OpenAI, Anthropic, Cohere, Google AI, Azure OpenAI Frameworks: LangChain, LlamaIndex, Haystack Vector Databases: Pinecone, ChromaDB, Weaviate, QdrantNext Steps
Gateway Configs
Fallbacks, caching, and load balancing
Model Catalog
Manage providers and credentials
Analytics
Cost and performance insights
MLflow Docs
Official documentation
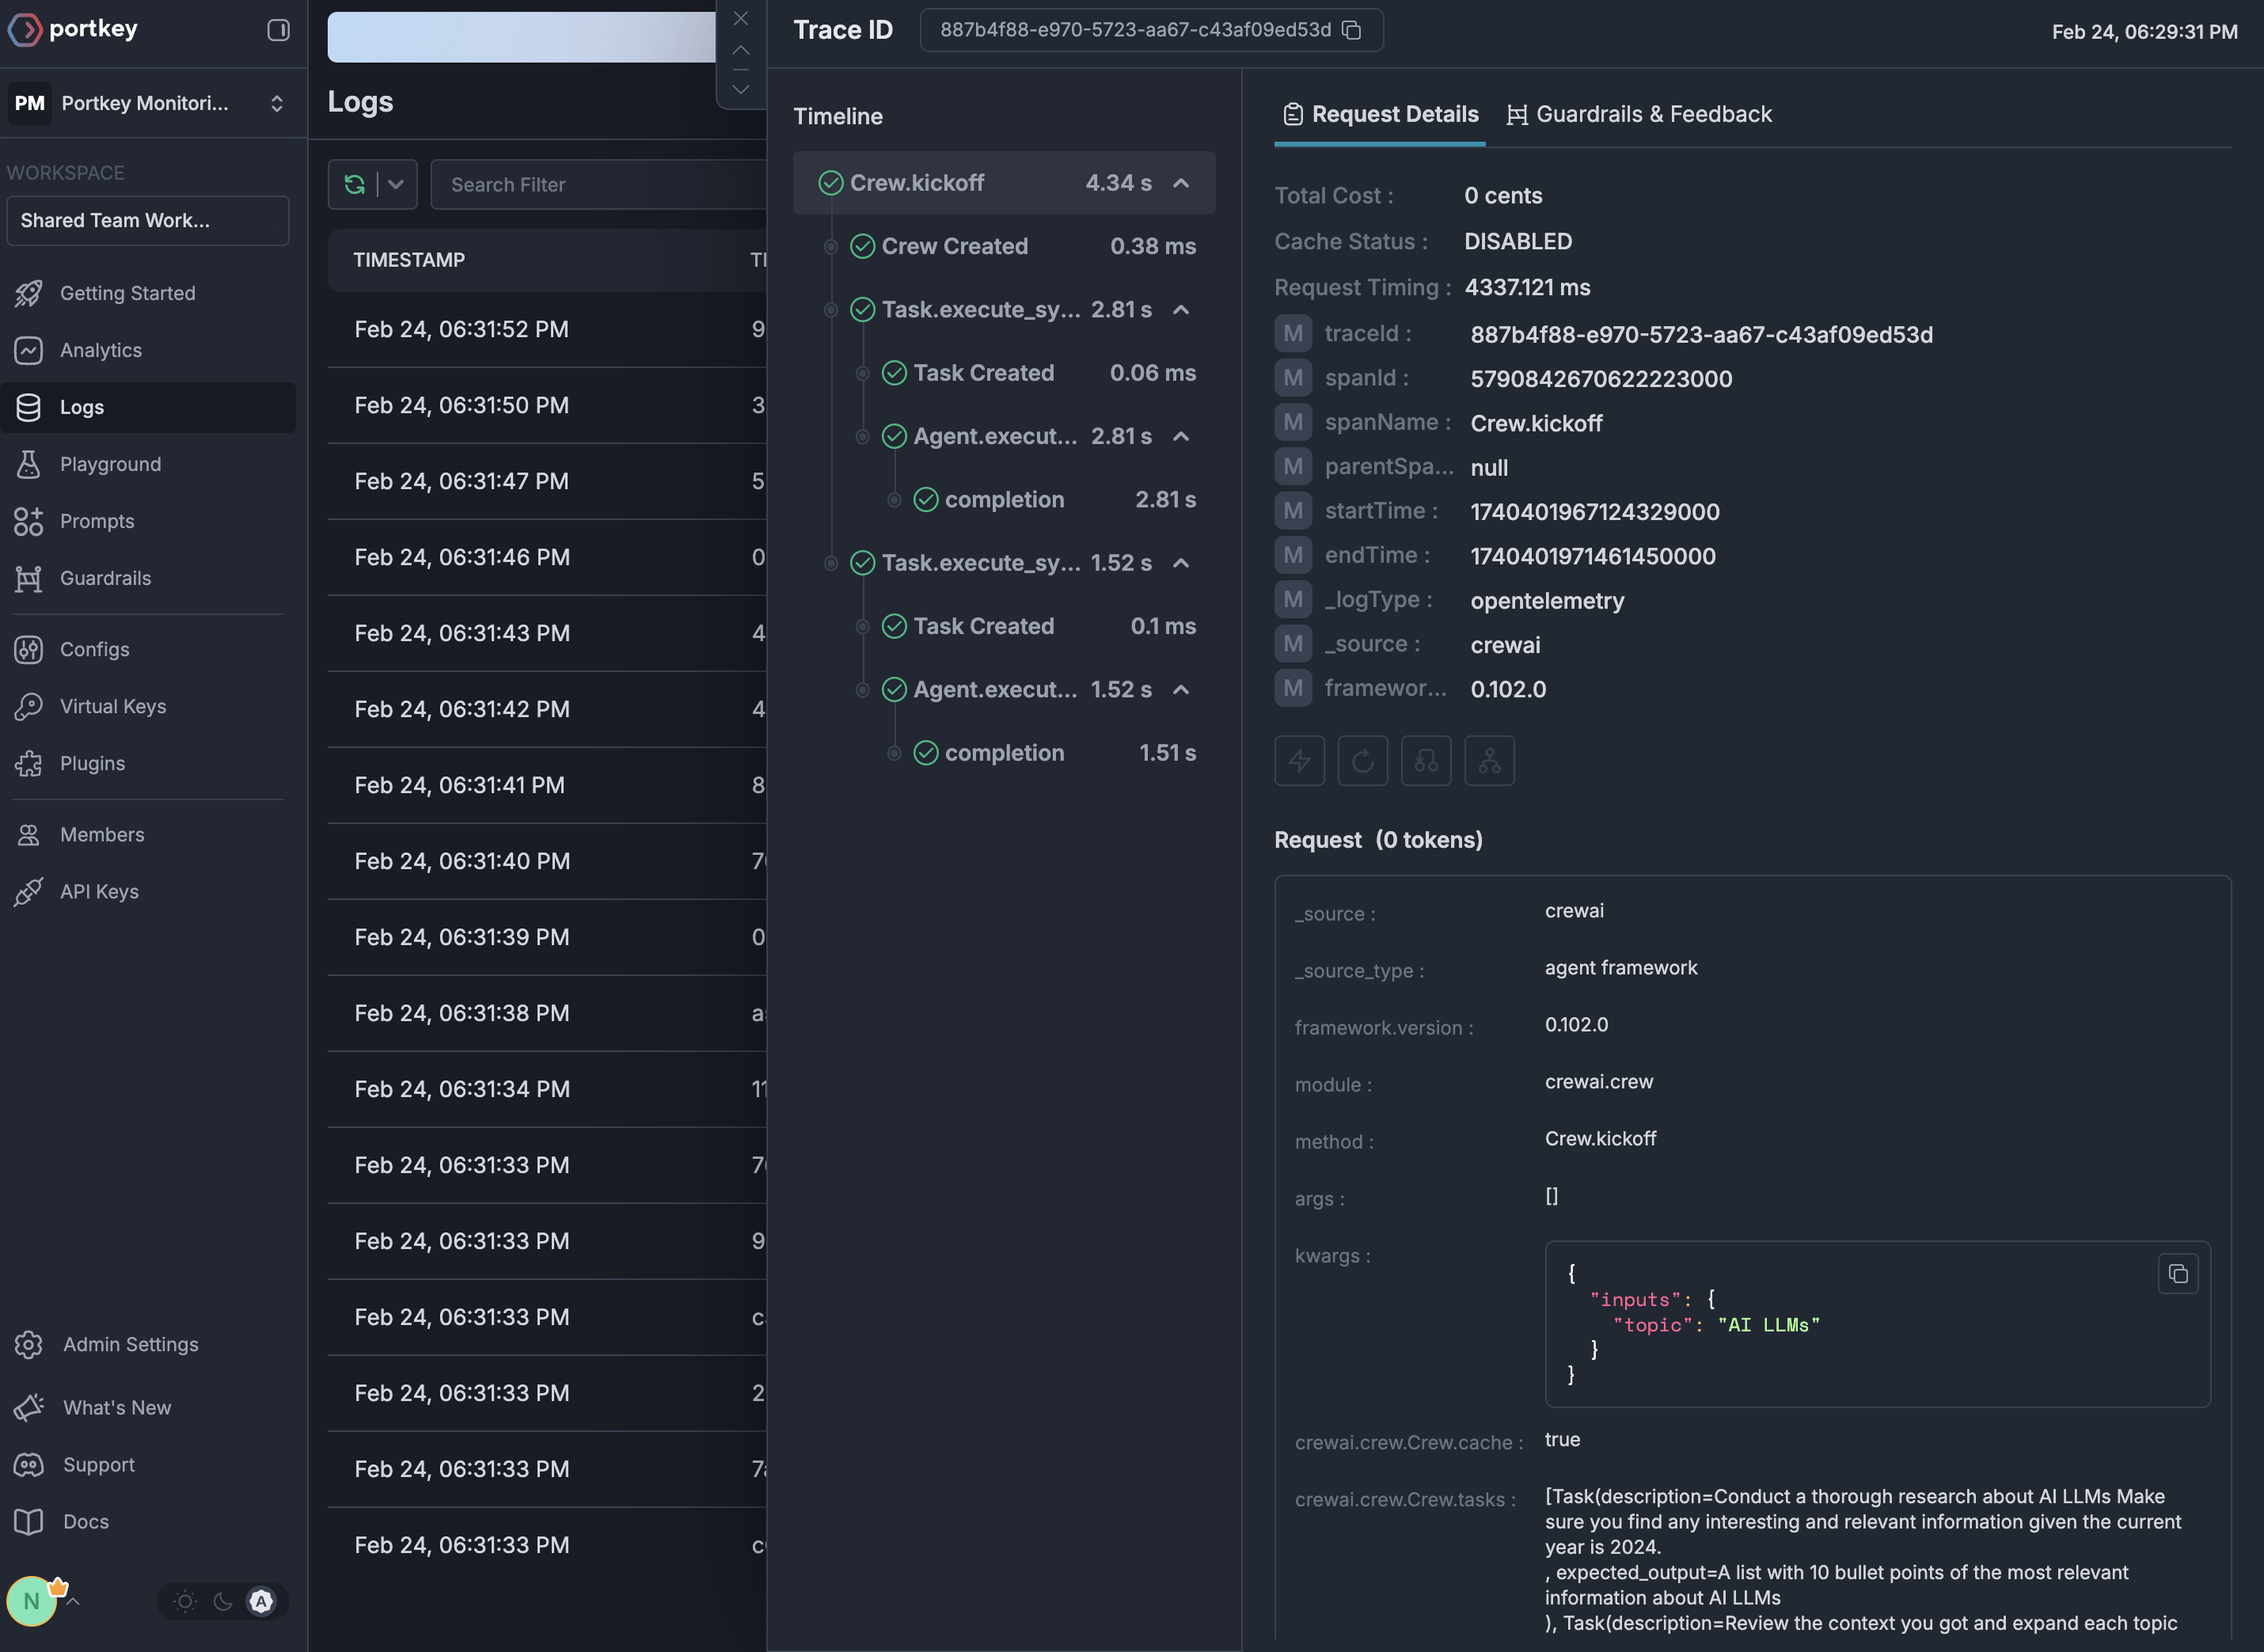
See Your Traces in Action
Once configured, view your MLflow instrumentation combined with Portkey gateway intelligence in the Portkey dashboard: