Why Phoenix + Portkey?
Visual Debugging
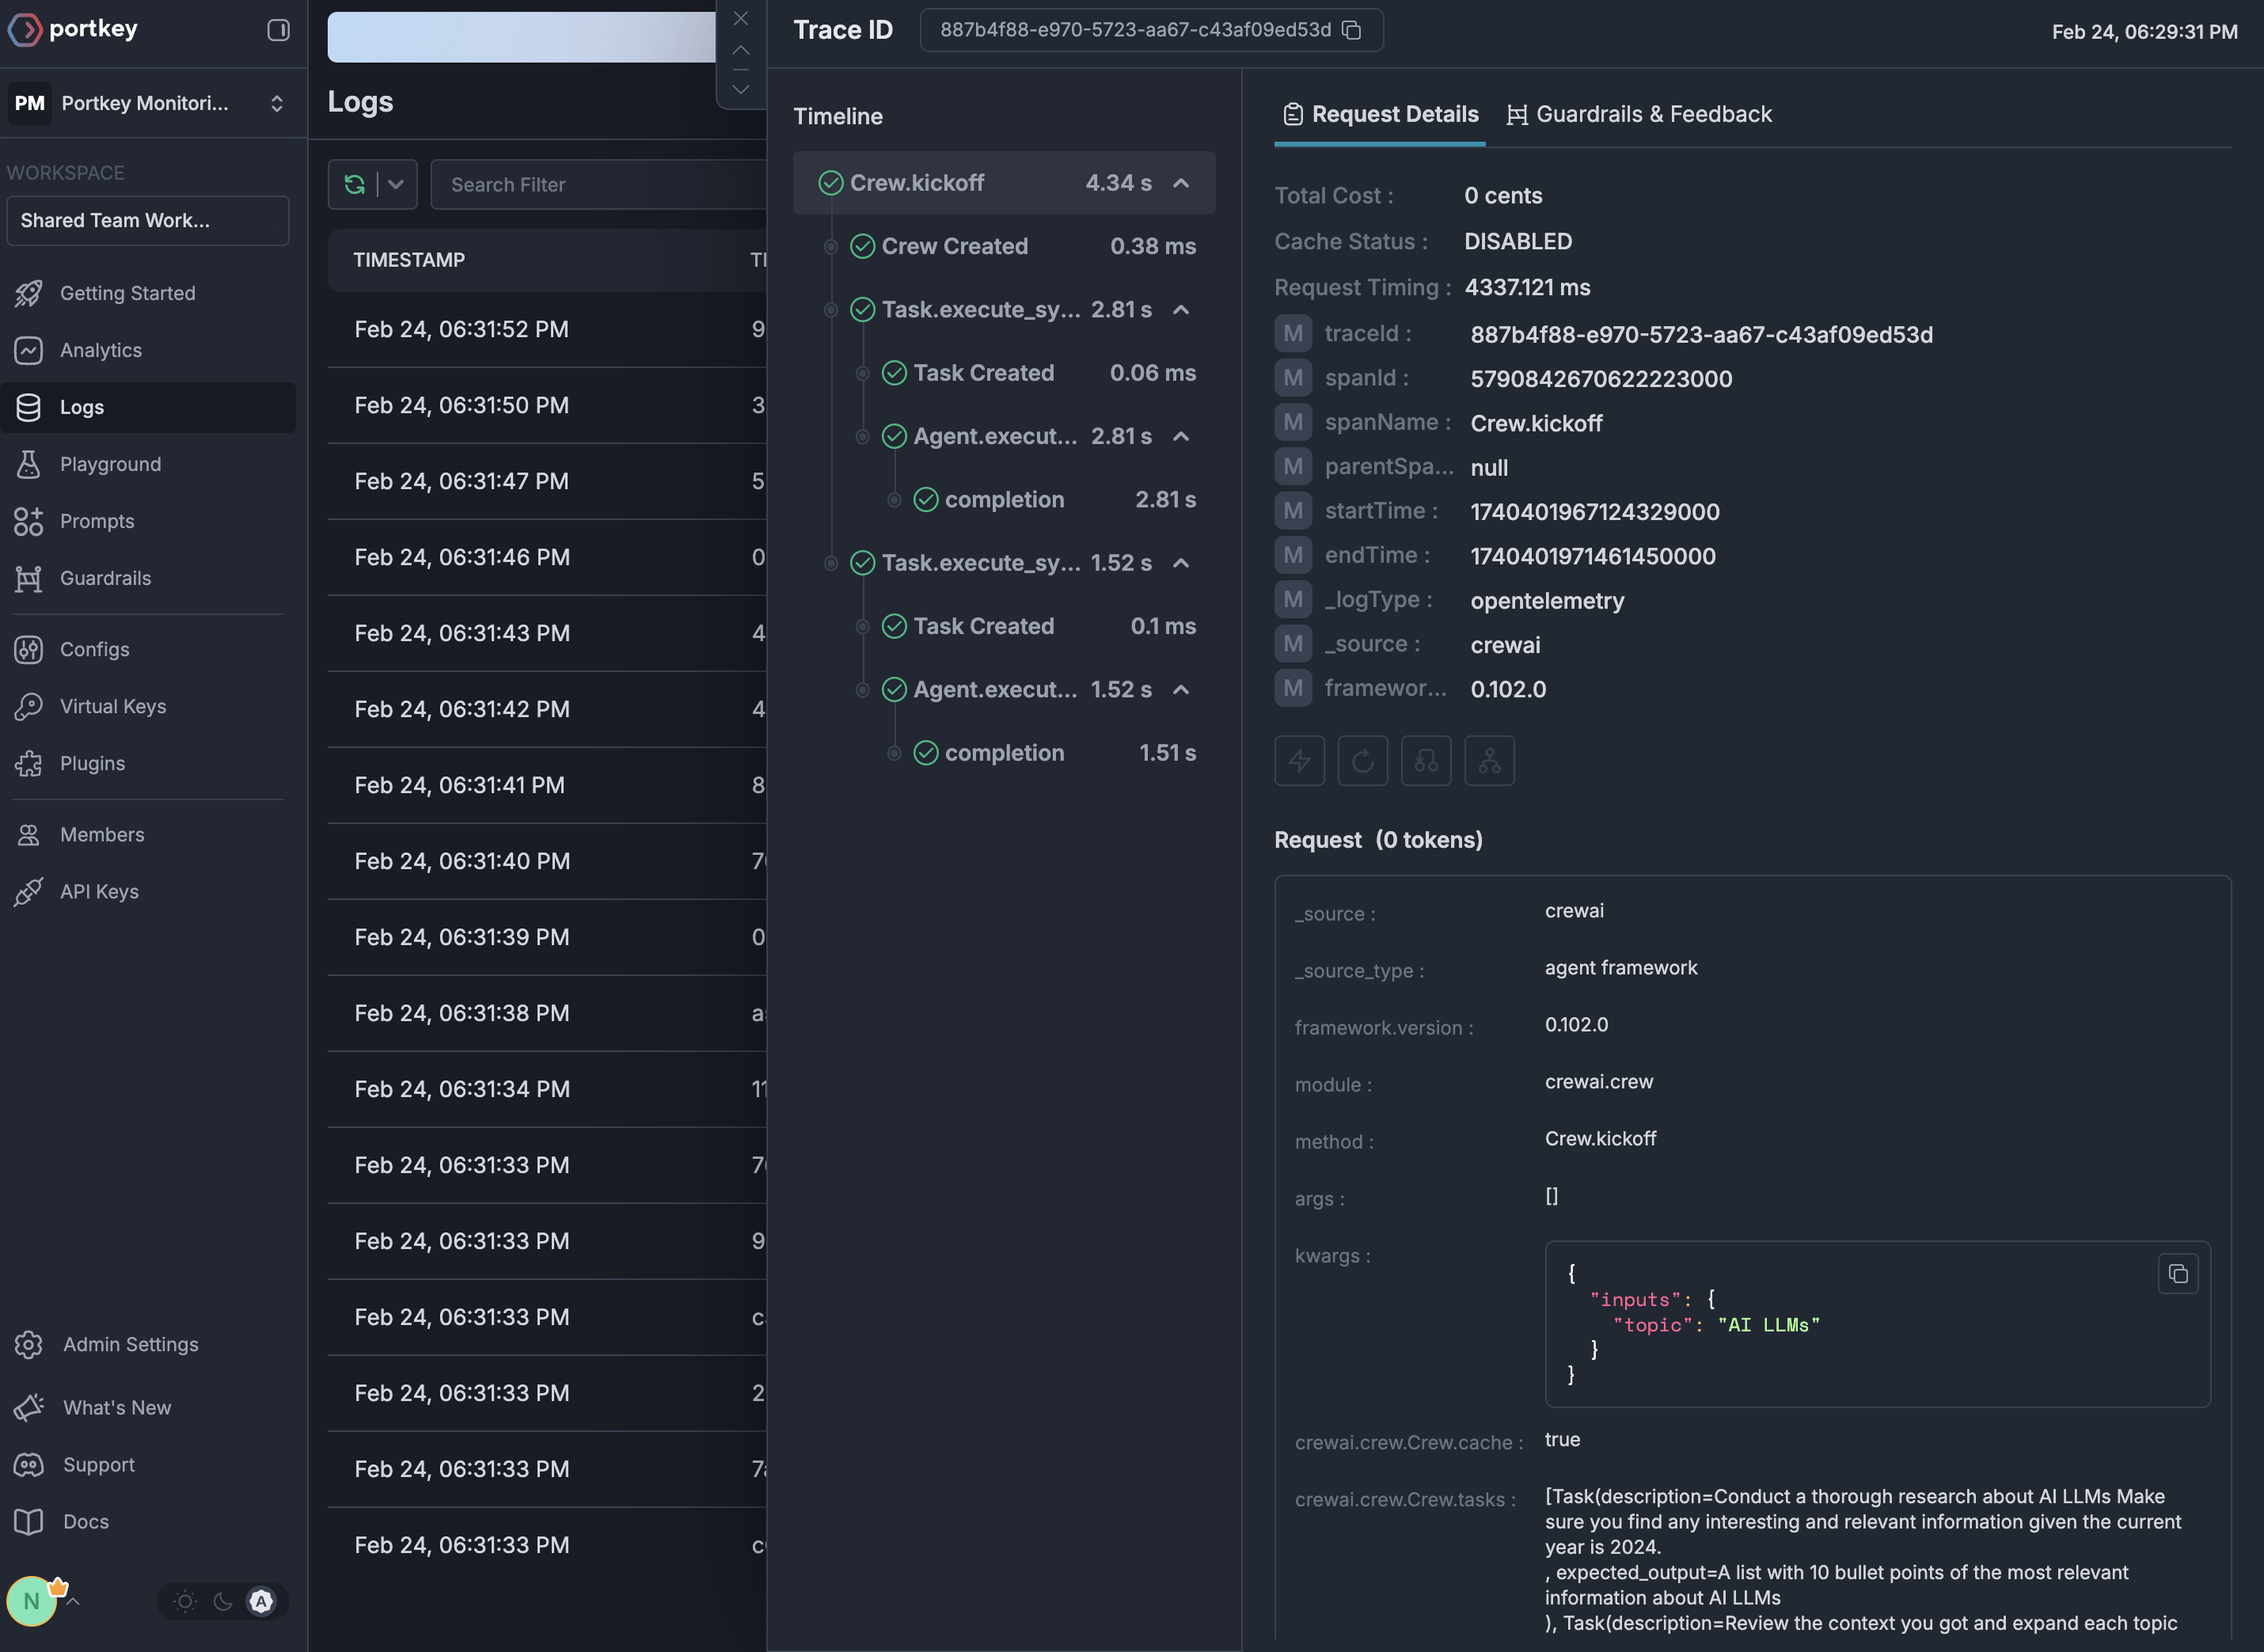
Powerful UI for exploring traces, spans, and debugging LLM behavior
OpenInference Standard
Industry-standard semantic conventions for AI/LLM observability
Evaluation Tools
Built-in tools for evaluating model performance and behavior
Gateway Intelligence
Portkey adds caching, fallbacks, and load balancing to every request
Quick Start
Setup
- Add provider in Model Catalog → get provider slug (e.g.,
@openai-prod) - Get Portkey API key
- Use
model="@provider-slug/model-name"in requests
What Gets Captured
Phoenix uses OpenInference semantic conventions:- Messages: Full conversation history with roles and content
- Model Info: Model name, temperature, and parameters
- Token Usage: Input/output token counts for cost tracking
- Errors: Detailed error information when requests fail
- Latency: End-to-end request timing
Configuration Options
Custom Span Attributes
Add custom attributes to your traces:Sampling Configuration
Control trace sampling for production:Troubleshooting
Traces not appearing in Portkey
Traces not appearing in Portkey
Ensure both
OTEL_EXPORTER_OTLP_ENDPOINT and OTEL_EXPORTER_OTLP_HEADERS are correctly set before initializing Phoenix.Missing instrumentation data
Missing instrumentation data
Call
OpenAIInstrumentor().instrument() before creating your OpenAI client.Next Steps
Gateway Configs
Fallbacks, caching, and load balancing
Model Catalog
Manage providers and credentials
Analytics
Cost and performance insights
Phoenix Docs
Official documentation
See Your Traces in Action
Once configured, view your Phoenix instrumentation combined with Portkey gateway intelligence in the Portkey dashboard: